Writing Module1. The two maps below show an island, before and after the construction of some tourist facilities. Summarise the information by selecting and reporting the main features, and make comparisons where relevant.
[参考范文]
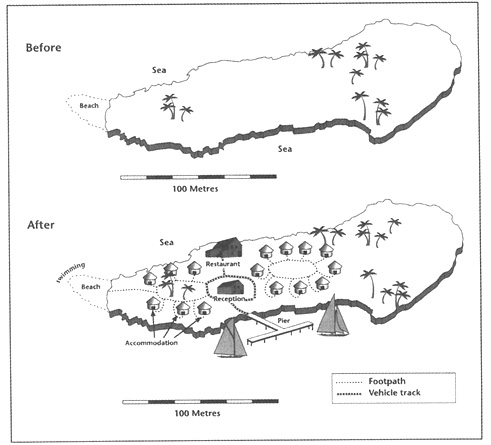
The maps illustrate an island before and after various facilities for tourists were constructed there.
Before, the island simply had some trees and a beach at its western end. Now, the trees and beach are still there, but other things have been added to the island. On the southern side of the island, a pier has been built for boats. A vehicle track leads north from the pier to a reception. The track goes around the reception and then further on to a restaurant on the north side of the island. To the east and west of the reception, accommodation has been built. There are six huts to the west and nine to the east. These two groups have been constructed around two circular footpaths with a short footpath leading to each hut. In the west, there is another footpath from the huts to the beach, where swimming is available.
2. Successful sports professionals can earn a great deal more money than people in other important professions. Some people think this is fully justified while others think it is unfair.
Discuss both these views and give your own opinion.
[范文]
As a result of constant media attention, sports professionals have become stars and celebrities, and those at the top are paid huge salaries. Some people think this is fully justified for successful sports professionals to earn much more money than people in other important professions while others hold opposite views. I am in favor of the view that it is fair for sports professionals to earn a great deal of money.
Many people find their rewards unfair, especially when comparing these super salaries with those of top surgeons or research scientists, or even leading politicians who have the responsibility of governing countries. However, athletes' salaries are not determined by considering the contribution to society a person makes, or the level of responsibility he or she holds. Instead, they reflect the public popularity of the sport in general and the level of public support that successful stars can generate. So the notion of "fairness" is not the issue.
Those who feel that sports stars' salaries are justified might argue that the number of professionals with real talent is very few, and the money is recognition of the skills and dedication a person needs to be successful. Competition is constant and a player is tested every time they perform in their relatively short career. The pressure from the media is intense and there is little privacy out of the spotlight. Thus all of these factors may justify the huge earnings.
Personally, I think that the amount of money such sports stars earn is justified not only because of the burden from media and the public, but also because of the intensity of training and competition. The huge salary also indicates that our society places much value on sport.
[解析] 1.语言表达
本文的语言简洁明了,观点清晰,文中一系列的连接词使文章更加连贯:however,so,instead,thus,but。
● Some people think this is fully justified for successful sports professionals to earn much more money than people in others important professions while others hold an opposite views. I am in favor of the view that it is fair for sports professionals to earn a great deal of money.
句型I am in favor of the view that...可用于议论文开头提出观点。
2.逻辑结构
本文是总分总结构的议论文。开篇先陈述事实并表达观点,第二段从反面切入后转向正面,第三段继续从正面论述观点,使论证更加客观严谨。第四段对全文进行总结,并重申自己的观点。
3. The graph below shows the consumption of fish and some different kinds of meat in a European country between 1979 and 2004. Summarise the information by selecting and reporting the main features, and make comparisons where relevant.

[参考范文]
The line chart shows consumption of fish, lamb, beef and chicken in a European country in grams per person per week (G/P/W) from 1979 to 2004.
Fish consumption is 60 G/P/W in 1979, dropping to slightly below 50 G/P/W by 1982 and thereafter fluctuating between 40 G/P/W and 50 G/P/W.
Lamb consumption is 150 G/P/W in 1979, falling to about 65 G/P/W in 2004. However, the fall is not continuous or even. For example, there is a rise from 110 G/P/W in 1985 to 130 G/P/W in 1987.
Consumption of beef follows a similar pattern to that of lamb. Overall, consumption drops from 220 G/P/W in 1979 to 110 G/P/W in 2004. Again, the fall in consumption is not even or continuous. Consumption falls significantly from 220 G/P/W in 1979 to 175 G/P/W in 1981, then rises dramatically to 240 G/P/W in 1983, remaining relatively steady for the next few years.
Chicken consumption is the only one that has risen, from 140 G/P/W in 1979 to 250 G/P/W in 2004. The rise is neither continuous nor even. Chicken consumption overtakes lamb consumption in 1980 and beef consumption in the late 80s.
In summary, beef and lamb consumption decrease significantly over the period, fish consumption drops slightly, while chicken consumption rises. Total meat consumption drops from about 570 G/P/W in 1979 to 470 G/P/W in 2004.
4. The pie chart below shows the main reasons why agricultural land becomes less productive. The table shows how these causes affected three regions of the world during the 1990s. Summarise the information by selecting and reporting the main features, and make comparisons where relevant.
| Causes of land degradation by region |
| Region | % land degraded by... |
| | deforestation | overcultivation | overgrazing | total land
degraded |
|
|
North America
Europe
Oceania* | 0.2
9.8
1.7 | 3.3
7.7
0 | 1.5
5.5
11.3 | 5%
23%
13% |
|
|
* A large group of islands in the South Pacific including Australia and New Zealand
[参考范文]
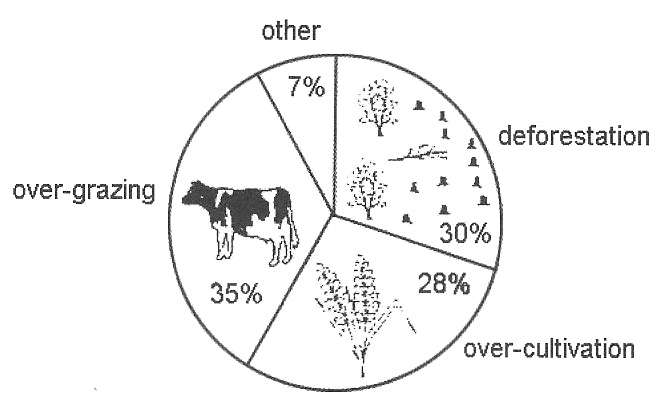
The pie chart and table show how land around the world was degraded during the 1990s-the former on a worldwide scale and the latter in three different regions.
Worldwide, over-grazing was the biggest cause of land degradation (35%), with deforestation causing 30% and over-cultivation causing slightly less (28%). Other factors caused 7% of land degradation.
The table shows that, during the 1990s, 23% of the land in Europe was degraded, more than in Oceania (13%) and far more than in North America (5%). In Oceania, over-grazing was primarily responsible for land degradation, with deforestation accounting for far less and none caused through over-cultivation. In North America, over-cultivation was the main reason, with about a third of land degradation being caused by over-grazing and very little being caused by deforestation. In Europe, deforestation was responsible for about 40% of the land degradation, over-cultivation about 30% and over-grazing about 20%.
To summarise, land degradation was due to three main factors and these factors differed in proportion in different regions.


 深色:已答题 浅色:未答题